“The earliest maps were ‘story’ maps. Cartographers were artists who mingled knowledge with supposition, memory, and fears. Their maps described both landscape and the events, which had taken place within it, enabling travelers to plot a route as well as to experience a story.” - Rory MacLean
By the mid-17th century, London had become the largest city in Britain and one of the largest in the West. Its expansive market and bustling port made it an epicenter of trade. Although the city produced and held tremendous wealth, it was nowhere near evenly distributed amongst its hundreds of thousands of inhabitants. London, having existed for centuries as a Roman settlement, had expanded significantly with a scant semblance of efficient city planning. Buildings within the prosperous central part of the city were spaced out and made of brick and concrete, while most of the surrounding city contained narrow alleys lined by countless dwellings of far cheaper construction comprised of wooden frames and siding and thatched rooves. To maximize space, buildings outside of the city center were also commonly built outward above the first floor, allowing larger footprints that hung over the alleys below and within arm’s reach of those across. There were laws prohibiting lower-quality building materials and how exactly construction should occur, but they were rarely followed and were even more loosely enforced—a lax approach that would prove devastating.
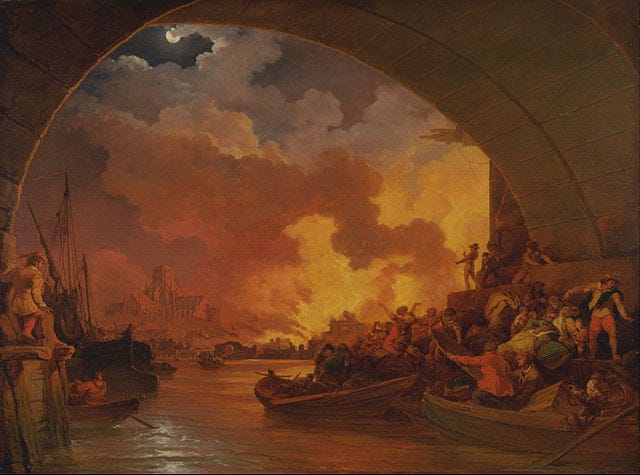
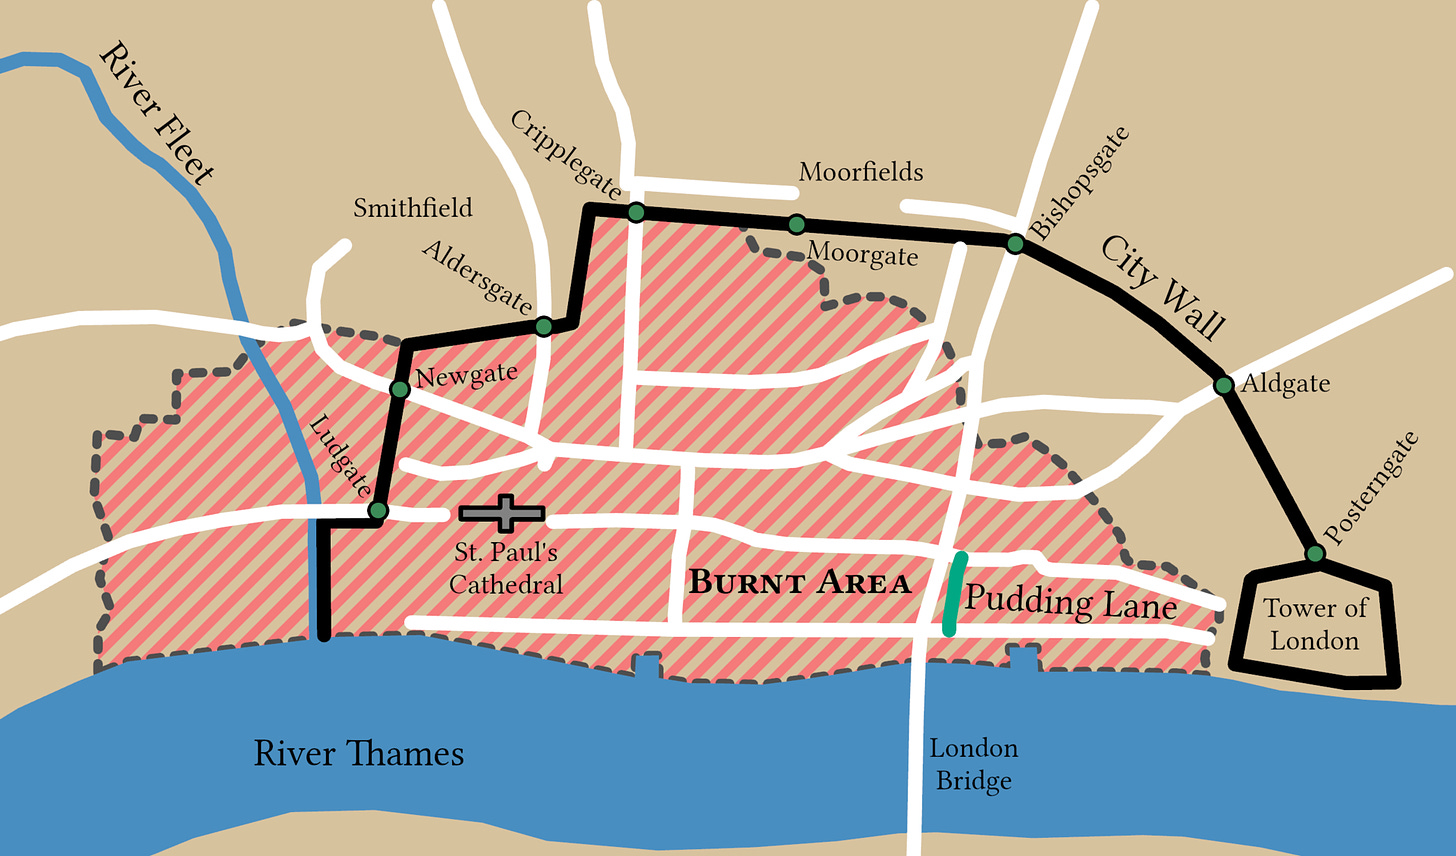
On Sunday, September 2nd, 1666, a bakery in Pudding Lane caught fire. Thomas Farriner, the bakery owner, and his family escaped by climbing out of a second-story window into the house next door. Neighbors’ attempts to quash the flames with buckets of water failed. An officer called for all surrounding buildings to be demolished to prevent the fire from spreading. Those who lived in those dwellings protested, requiring the Lord Mayor, Sir Thomas Bloodworth, to come and make an official determination of action. However, when he arrived, he hesitated and then ultimately decided to avoid demolitions, an act he viewed as excessive. His decision would prove most destructive.
A strong wind from the East fanned the flames into a rage that spread effortlessly. Despite the initial source of the fire being relatively close to the River Thames, the fire thwarted access, and the narrow alleys prevented water wagons from getting close enough to be effective. Fleeing inhabitants were instructed to stay inside to keep the streets clear for incoming firefighters. But as the winds continued to roar, evacuations became unavoidable, creating significant congestion. The surrounding city wall reduced potential escape to just eight gates, which was further reduced as the flames engulfed several of those, too.
From Sunday, September 2nd, to Wednesday, September 5th, the fire destroyed over 13,000 houses and 130 large buildings across the substantial majority of acreage within the city walls, placing the total damage at around £2 billion in today’s terms. Despite the enormous scale of the fire, official records report that less than 10 people died during the Great Fire of London. It is only right to immediately find such a figure suspect, as many deaths of the poor were likely unrecorded, and the sheer voraciousness of the fire likely left only skeletal remains of some that would have been obfuscated in the resulting rubble. Not to mention the official death toll also excludes future accidents from compromised buildings and the deaths of those displaced into crowded camps.
Although the Great Fire of London caused significant economic damage to a city still reeling from the Great Plague pandemic just a year earlier, the event benefitted a select few. At the time of the fire, those desperate to escape also wanted to save their valuables. The cost to rent a large cart to transport belongings rose from a pitance to over £135,000 in today’s terms. Hauler boats also profited handsomely. Following the fire, construction saw a significant boom, and hundreds of millions of bricks, significant sums of other building materials, and skilled labor were all needed. And while significant fortunes had been incinerated by the fire, those still wealthy were eager to partake in bond offerings used to finance the reconstruction efforts.
One of the beneficiaries in the aftermath was the insurance industry, which, as we know it today, was largely born from those flames. In 1681, Nicholas Barbon founded the first property insurance company, the Insurance Office of Houses. Eventually, the company wrote policies for more than 5,000 houses. Many attempted to emulate Barbon’s business, though they often failed due to mounting losses. In order to reduce the chance of business failure, the Insurance Office of Houses and other firms hired their own fire departments to dispatch to houses they had written policies for. To instill a sense of safety, as well as promote their businesses, insurance firms also provided insurance emblems to hang outside of the buildings they insured.
Fast-forward two hundred years after the Great Fire of London, the property insurance industry, while no longer nascent, was still far from having the mature and sophisticated stature it holds today. The American Civil War had just ended, and the United States contained immense uncertainty and opportunity alike (some of which I recently covered in Hetty Green: Unspent Fortune.) The country experienced mass immigration, fledgling towns blossomed into sprawling cities, and railroad companies competed in a race to connect pocketed societies booming from the seemingly endless availability of natural resources. To protect vast and fast-growing economic interests, especially in dense urban areas, property insurance became widely sought.
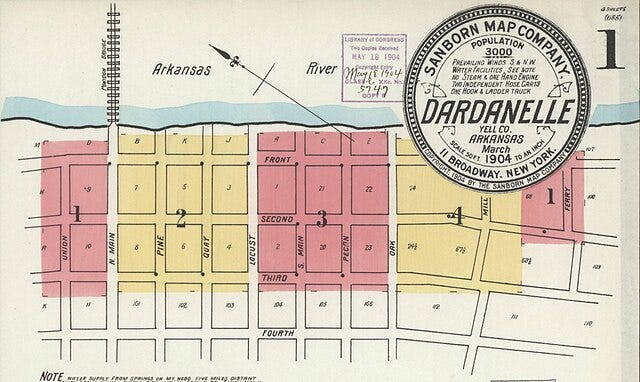
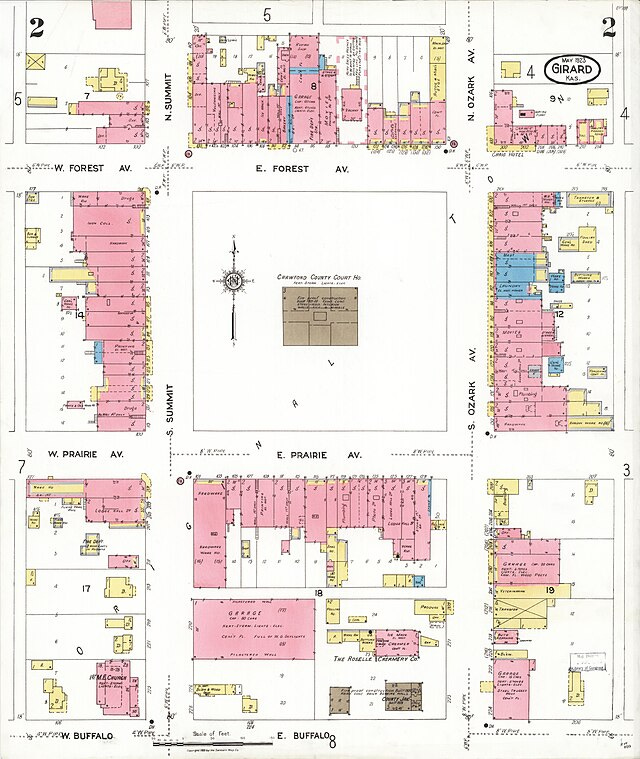
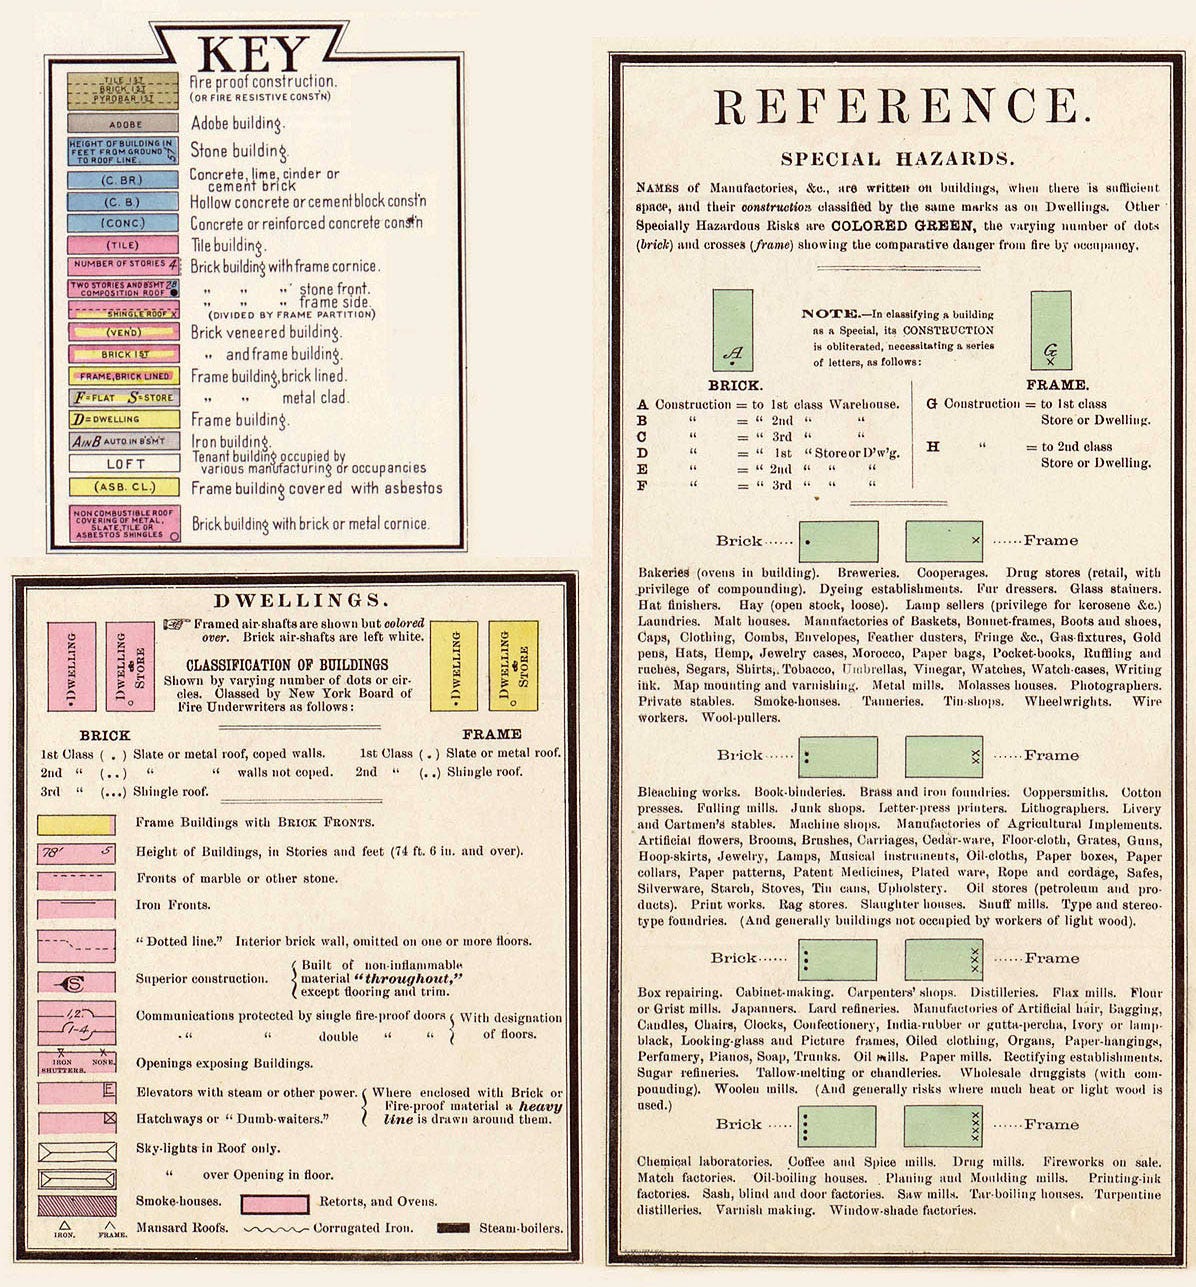
Over the prior century, the insurance houses of London had begun to utilize city maps detailing building proximity, construction materials, window and door locations, road and river access, distance from fire departments, and other nuances to better assess underwriting risks and appropriate policy premiums. Adopted by early insurers in the United States, Aetna Insurance Company hired Daniel Alfred Sanborn to create similarly detailed maps of cities in Tennessee. In 1867, seeing the fervent demand for fire insurance and the importance of maps, Sanborn founded the D. A. Sanborn National Insurance Diagram Bureau.
Sanborn’s model was straightforward: Slowly create high-quality, detailed maps; quickly create copies to sell to numerous insurance companies; charge a hefty fee to subscribed insurance companies when their maps are out-of-date (which can happen rather quickly for fast-growing cities), sending representatives to paste over old maps with updated excerpts. The model wasn’t just simple; it was beautifully high-margin, capital-light, and a critical component in clients’ business operations, ensuring stable sales.
Through rapid growth, D. A. Sanborn was able to buy several competitors, resulting in continued name changes until the company simply became known as the Sanborn Map Company. Nearly four decades after its founding, Sanborn acquired its sole remaining large competitor in 1916, E. Hexamer & Sons of Philadelphia, providing the company with a monopoly. A decade later, the company employed over 700 field surveyors, cartographers, printers, managers, salesmen, and support.
Sanborn’s monopoly status afforded it tremendous pricing power, much to the dismay of the insurance companies. A coalition of insurers explored creating their own mapping service but ultimately abandoned the idea after determining that creating a body of work similar to Sanborn’s archive would be prohibitively expensive. Instead, after much expressed dissatisfaction, Sanborn provided seats on its board to several prominent insurance executives.
A funny thing about monopolies is that when times are good, you get the spoils all to yourself, but when times are bad, the pain is yours and yours alone. In the 1950s, the insurance industry began underwriting fire policies by line carding—a practice already in use for other types of insurance. Line carding utilized the transferring of much of the information that would be on a fire insurance map onto cards using a standardized system. Cards allowed for a greater density of information, were more easily updated, could quickly be filed and retrieved, and entire card systems could be rapidly updated if new information sets needed to be included to better assess underwriting risks. The entire process could be done in-house by insurers, avoiding the lofty prices charged by Sanborn and the lag time of waiting for map revisions.
The rise of line carding was a significant blow to Sanborn. Not only was the company losing customers, but the increased efficiency of the fire insurance industry led to significant consolidation through mergers and acquisitions, further reducing the pool of insurers willing to purchase maps. Sanborn’s after-tax profits from its map business went from generating over $500,000 per year in the late 1930s to under $100,000 in 1958 and 1959. It is no coincidence that Sanborn caught the interest of Warren Buffett in those latter years, and he began to buy shares in the company hand over fist with the capital of the Buffett Limited Partnership. In Buffett’s annual letters to limited partners over the two-year stretch, he remained notably tight-lipped about exactly what company had caught his attention, avoiding naming it directly.
In 1958, Buffett wrote (emphasis added):
Late in the year we were successful in finding a special situation where we could become the largest holder at an attractive price, so we sold our block of Commonwealth obtaining $80 per share although the quoted market was about 20% lower at the time.
It is obvious that we could still be sitting with $50 stock patiently buying in dribs and drabs, and I would be quite happy with such a program although our performance relative to the market last year would have looked poor. The year when a situation such at Commonwealth results in a realized profit is, to a great extent, fortuitous. Thus, our performance for any single year has serious limitations as a basis for estimating long term results. However, I believe that a program of investing in such undervalued well protected securities offers the surest means of long term profits in securities.
I might mention that the buyer of the stock at $80 can expect to do quite well over the years. However, the relative undervaluation at $80 with an intrinsic value $135 is quite different from a price $50 with an intrinsic value of $125, and it seemed to me that our capital could better be employed in the situation which replaced it. This new situation is somewhat larger than Commonwealth and represents about 25% of the assets of the various partnerships. While the degree of undervaluation is no greater than in many other securities we own (or even than some) we are the largest stockholder and this has substantial advantages many times in determining the length of time required to correct the undervaluation. In this particular holding we are virtually assured of a performance better than that of the Dow-Jones for the period we hold it.
And, in 1959, he noted (emphasis added):
Last year, I mentioned a new commitment which involved about 25% of assets of the various partnerships. Presently this investment is about 35% of assets. This is an unusually large percentage, but has been made for strong reasons. In effect, this company is partially an investment trust owing some thirty or forty other securities of high quality. Our investment was made and is carried at a substantial discount from asset value based on market value of their securities and a conservative appraisal of the operating business.
We are the company’s largest stockholder by a considerable margin, and the two other large holders agree with our ideas. The probability is extremely high that the performance of this investment will be superior to that of the general market until its disposition, and I am hopeful that this will take place this year.
In his 1960 letter to limited partners, Buffett revealed Sanborn’s name and many of its celebrated qualities: monopolistic pricing power, recession resistance, lack of capital intensity, and so on. He also highlighted the very real damage done to the company by the recent adoption of line carding. More critically, he laid out with precision what was indicated in the previous year’s letter regarding the company’s portfolio of marketable securities (emphasis added):
However, during the early 1930's Sanborn had begun to accumulate an investment portfolio. There were no capital requirements to the business so that any retained earnings could be devoted to this project. Over a period of time, about $2.5 million was invested, roughly half in bonds and half in stocks. Thus, in the last decade particularly, the investment portfolio blossomed while the operating map business wilted.
Let me give you some idea of the extreme divergence of these two factors. In 1938 when the Dow-Jones Industrial Average was in the 100-120 range, Sanborn sold at $110 per share. In 1958 with the Average in the 550 area, Sanborn sold at $45 per share. Yet during that same period the value of the Sanborn investment portfolio increased from about $20 per share to $65 per share. This means, in effect, that the buyer of Sanborn stock in 1938 was placing a positive valuation of $90 per share on the map business ($110 less the $20 value of the investments unrelated to the map business) in a year of depressed business and stock market conditions. In the tremendously more vigorous climate of 1958 the same map business was evaluated at a minus $20 with the buyer of the stock unwilling to pay more than 70 cents on the dollar for the investment portfolio with the map business thrown in for nothing
This situation epitomized the principal force behind Benjamin Graham's investing philosophy, Buffett’s mentor: The margin of safety.
Was the substantial discount provided by the market irrational? Not entirely. Buffett pointed out that the board of directors, in total, owned very few shares of Sanborn. Without real skin in the game, their incentives weren’t aligned with shareholders, and the discount could have easily persisted or even widened:
The very fact that the investment portfolio had done so well served to minimize in the eyes of most directors the need for rejuvenation of the map business. Sanborn had a sales volume of about $2 million per year and owned about $7 million worth of marketable securities. The income from the investment portfolio was substantial, the business had no possible financial worries, the insurance companies were satisfied with the price paid for maps, and the stockholders still received dividends. However, these dividends were cut five times in eight years although I could never find any record of suggestions pertaining to cutting salaries or director's and committee fees.
By acquiring a substantial position in the company and gaining the favor of other major shareholders, Buffett was able to create the catalyst the realize substantial value:
Subsequently our holdings (including associates) were increased through open market purchases to about 24,000 shares and the total represented by the three groups increased to 46,000 shares. We hoped to separate the two businesses, realize the fair value of the investment portfolio and work to re-establish the earning power of the map business. There appeared to be a real opportunity to multiply map profits through utilization of Sanborn's wealth of raw material in conjunction with electronic means of converting this data to the most usable form for the customer.
There was considerable opposition on the Board to change of any type, particularly when initiated by an outsider, although management was in complete accord with our plan and a similar plan had been recommended by Booz, Allen & Hamilton (Management Experts). To avoid a proxy fight (which very probably would not have been forthcoming and which we would have been certain of winning) and to avoid time delay with a large portion of Sanborn’s money tied up in blue-chip stocks which I didn’t care for at current prices, a plan was evolved taking out all stockholders at fair value who wanted out. The SEC ruled favorably on the fairness of the plan. About 72% of the Sanborn stock, involving 50% of the 1,600 stockholders, was exchanged for portfolio securities at fair value. The map business was left with over $1,25 million in government and municipal bonds as a reserve fund, and a potential corporate capital gains tax of over $1 million was eliminated. The remaining stockholders were left with a slightly improved asset value, substantially higher earnings per share, and an increased dividend rate.
Buffett generated an approximate 50% return on the Sanborn Maps deal for the Buffett Limited Partnership. Seven years later, under the Berkshire Hathaway umbrella, Buffett entered insurance operations directly by acquiring National Indemnity Company.
If you enjoyed this piece, hit “♡ like” on the site and give it a share. To further show your support, consider pledging a paid subscription to Invariant.
Questions or thoughts to add? Comment here or message me on Twitter.
Ownership Disclaimer
I own positions in Berkshire Hathaway.
Disclaimer
This publication’s content is for entertainment and educational purposes only. I am not a licensed investment professional. Nothing produced under the Invariant brand should be thought of as investment advice. Do your own research. All content is subject to interpretation.


Excellent write up. Fascinating story
What a fun read. Thanks for putting it together!