Altria: Recalibration
“Regulation not enforced is indistinguishable from no regulation at all.” - William Gifford, Altria CEO, Q3 2023 Call
Altria’s Q3 2023 presentation included a change to its decomposition estimates for U.S. cigarette industry volumes. Prior, the company provided “Additional Cross Category Movement” and “Macroeconomic & Other Factors” as separate figures, and over the last several years had attributed higher volume declines largely to macro factors. However, in Q3 2023, the company stated it had underestimated Additional Cross-Category Movement to e-vapor and now believes it to be 1.5-2.5% TTM. The company combined these two figures, somewhat obfuscating the change, which is found in the footnotes of slide 16 of the Q3 earnings presentation. I have illustrated the midpoint of the new ACCM adjustment—unmissably visualized in yellow on the most recent trailing twelve-month figure below:

Management addressed the change directly on the Q3 call, admitting to the difficulty of measuring illicit e-vapor volumes as they are predominantly sold in untracked channels (that difficulty is also implied by the sheer fact the company provided the wide 1.5-2.5% range). Tucking the data into the footnotes is a flagrant foul that management should sit in the penalty box for. But does this break the Altria thesis?
Poor enforcement. Government lip service. Uncertain litigation. Without favorable outcomes, U.S. cigarette volumes likely continue to decline at an elevated rate to an extent—even if macro pressures ease, additional cross category movement will persist. But this isn’t new information. This has been continually pointed to by industry data and a number of analysts, and I questioned these exact dynamics in April following Q1 results (emphasis added):
None of this is to say that the trend will fully mean-revert to the 4-5% annual decline rate we’ve seen historically. That should have never been expected. For starters, an additional concern related to the US cigarette industry volume declines is cross-category movement. The secular decline rate of -2.5% remains unchanged and automatically includes a 1% impact of cross-category movement, but Q1 2023 listed a 0% additional contribution. Can this be right? We know there is a cross-category shift occurring from legacy to modern oral, but according to Altria, the shift to e-vapor, which was for a time the largest driver, has been stunted. Gifford explained on the Q1 call:
“We believe the category is continuing to undergo a significant reset, and we estimate that first-quarter e-vapor volumes decreased 11% versus a year ago and 1% sequentially. We have observed a decline in traditional multi-outlet and convenience channel volumes, which we believe is primarily a result of the FDA marketing denial orders issued for JUUL and MyBlu. This volume decline has been partially offset by increased volume in nontraditional channels, such as e-commerce and vape stores.”
While Altria’s explanation makes sense and is supported by the category volume chart above, I think it’s still worth questioning. We’ve seen evidence of the proliferating popularity of disposable vapes, and many of the sales channels in which they’re sold simply aren’t tracked as well. And since e-vapor broadly is converting smokers and would-be smokers, this assuredly continues to impact legacy volumes.
Is it the mere fact that Altria is attempting to now more appropriately quantify the impact that has investors spooked? Perhaps. Maybe it’s animal spirits with Halloween around the corner. Regardless, while attribution has changed, volume declines remain elevated—and yet, Altria’s value-creating formula remains intact.
Smokeable Products
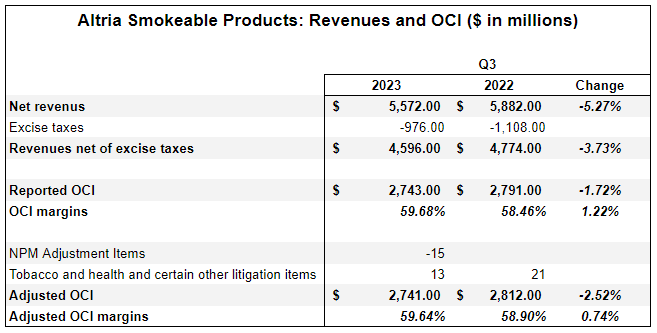
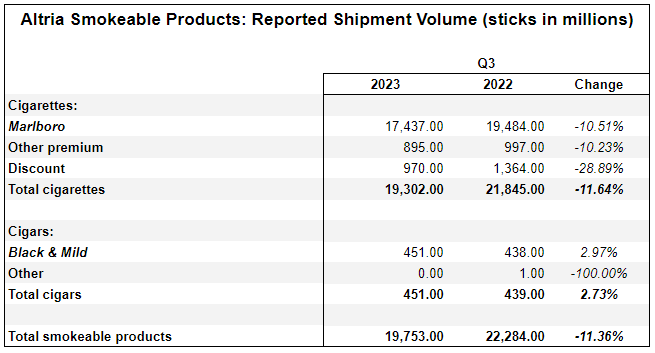
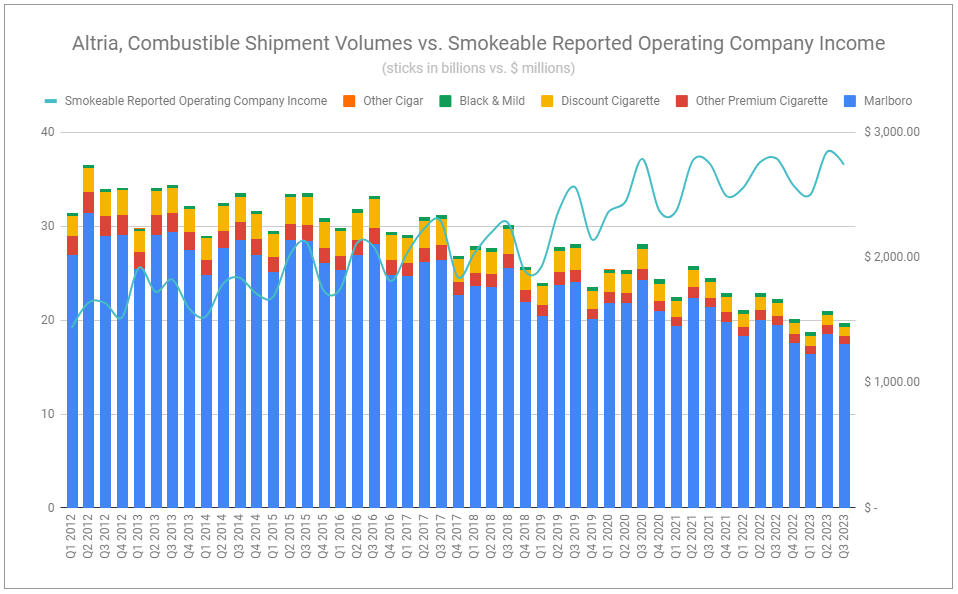
Q3 Smokeable volumes fell -11.36% y/y. Adjusted for channel movements and factoring one less shipping day in the quarter vs. last year, volumes decreased by an estimated -10%—unchanged sequentially. However, unlike Q2, pricing did not offset volume declines, leading to reported and adjusted operating income falling by -1.72% and -2.52%, respectively.
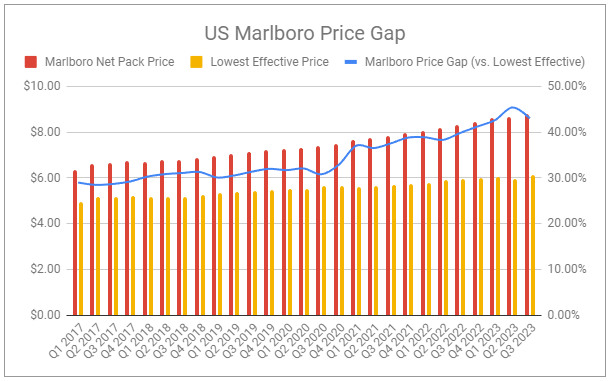
Counter to the negative trends above, albeit with less material impact, are several positive points deserving of mention. The price gap of Marlboro in the U.S. vs the lowest effective price came down 2.39pp vs Q2, although still markedly elevated relative to historical averages.
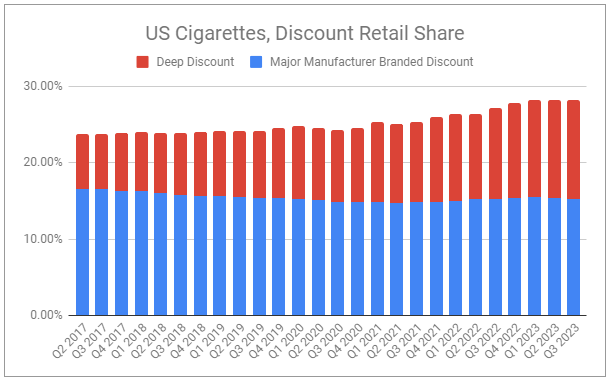
This is also reflected in the aggregate discount retail share remaining flat Q/Q at 28.2%.
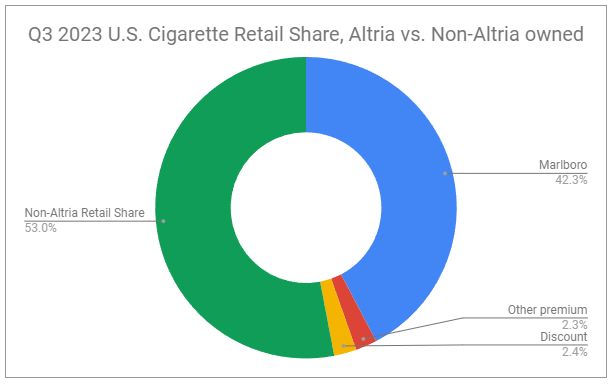
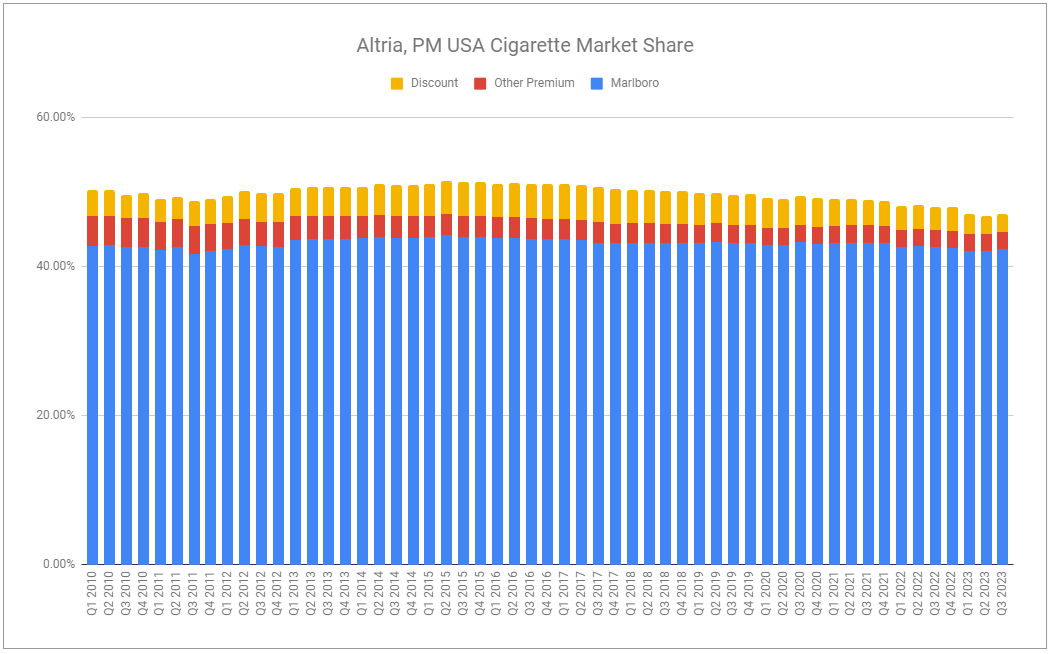
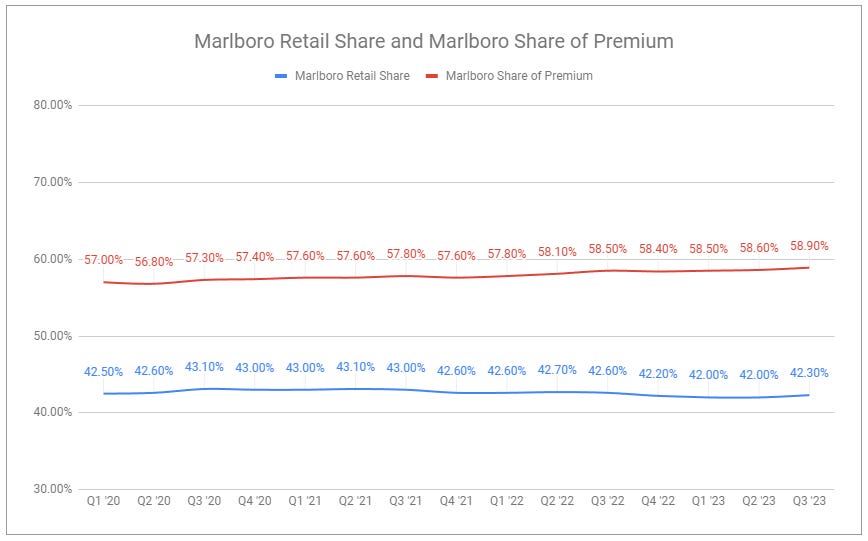
In terms of positioning, while Marlboro declined 30bps y/y in retail share, its share of premium increased 40bps y/y and 30bps sequentially.
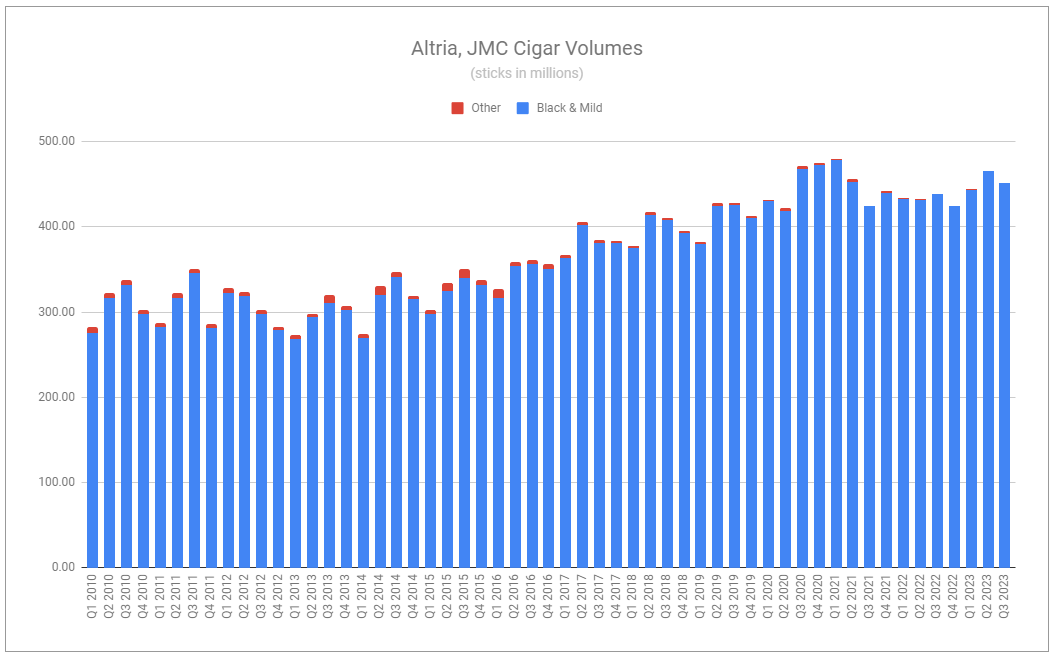
Additionally, while still only representing a small single digit of combustibles, John Middleton’s Black & Mild cigar volumes once again impressed, up 3% y/y despite continued strong pricing.
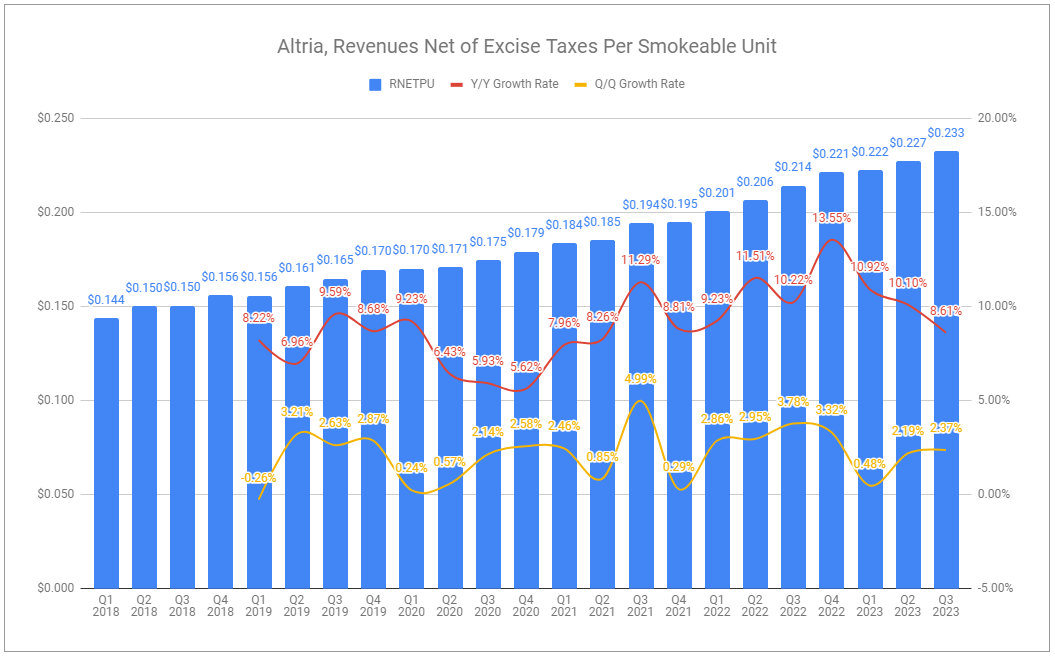
At reduced volumes, Q3 showed revenues net of excise taxes per smokable unit are up 8.61% y/y and 2.37% sequentially.
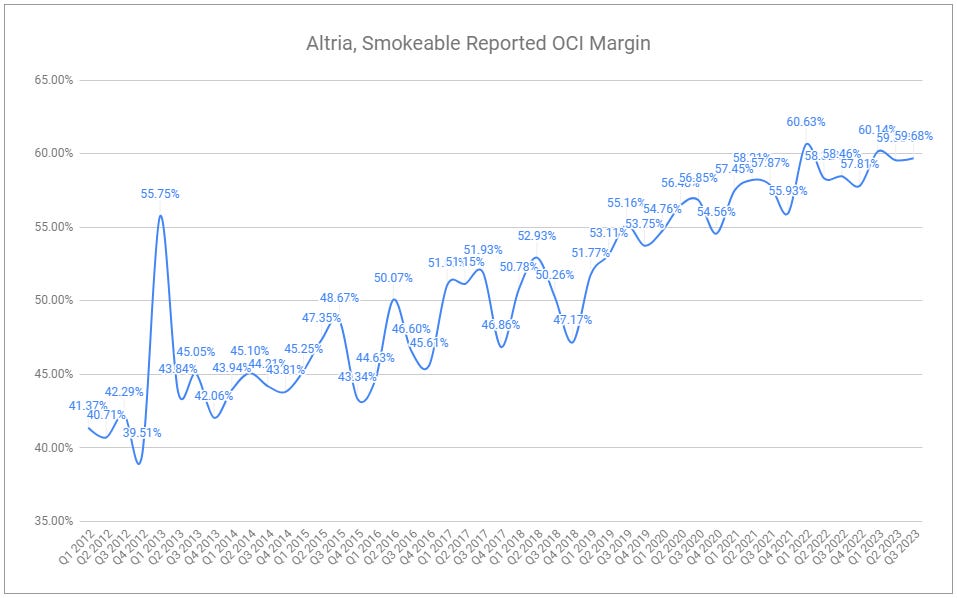
Despite evident elevated input cost inflation, reported OCI margin increased, up 1.22pp y/y, and up 0.74pp adjusted.
Oral Tobacco Products
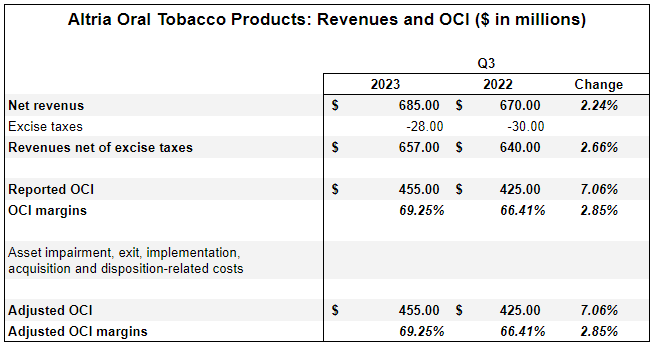
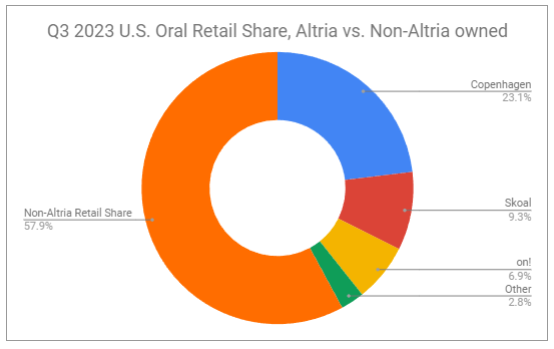
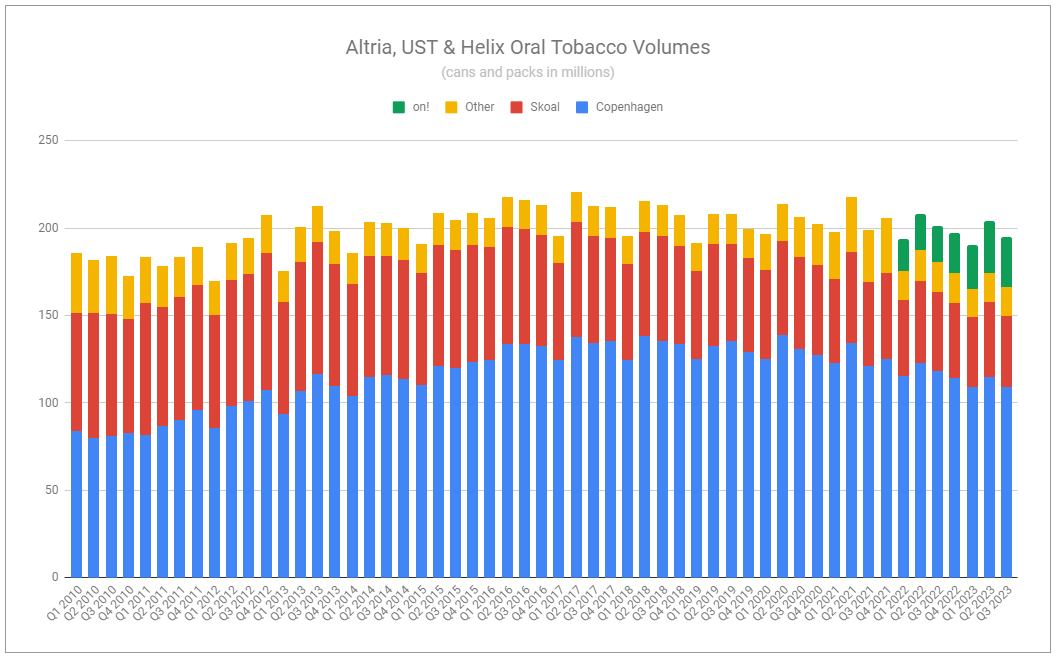
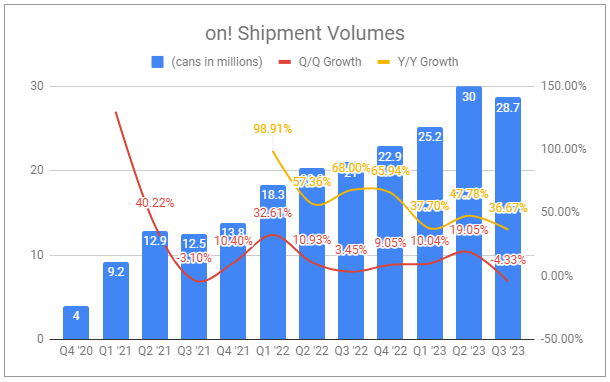
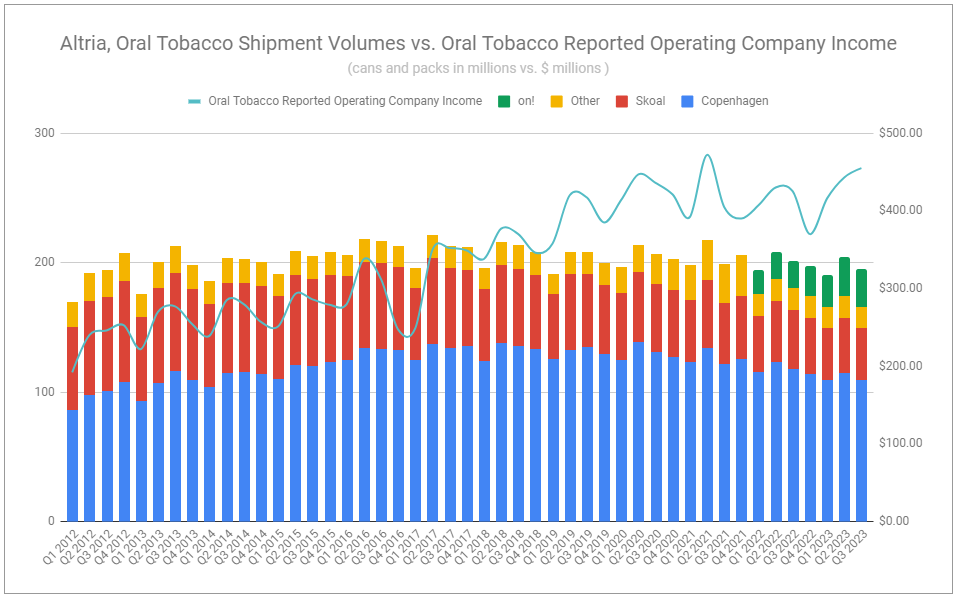
Segment results for Altria’s Oral Tobacco once again looked markedly different than Smokeables. Volumes, adjusted for one fewer shipment day in the quarter and channel movements, fell 2% y/y for the quarter, and -2.5% for the first nine months of the year. Quarterly reported total volumes were down -3.28%, driven by steep drops in legacy products Copenhagen and Skoal of -7.45% and -10.82%, respectively, heavily offset by growth in modern oral nicotine pouch on! volumes. Quarterly reported on! shipment volumes measured 28.7 million, a 36.67% increase y/y but both a q/q decrease and a continued deceleration. In isolation, this appears much less impressive than PMI’s ZYN trajectory. Further, Altria’s Oral Tobacco segment share of the total U.S. market continued to shrink, with legacy volumes being cannibalized, predominantly by on! and ZYN. But as always, focusing on volumes or market share in isolation misses the forest for the trees.
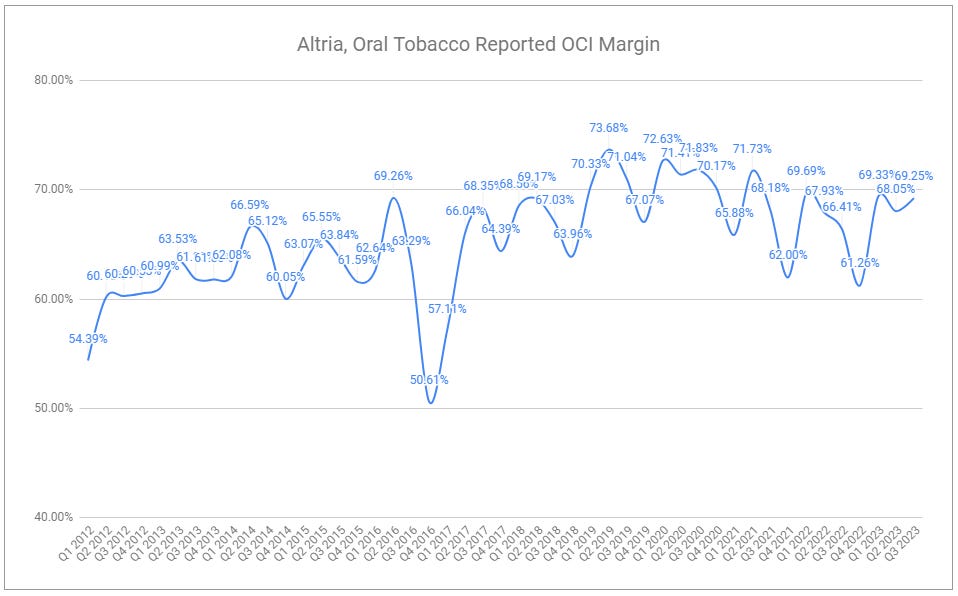
The sustained growth of on! was despite further cuts to promotional efforts and increases in price, with the average retail price per can up 33% from Q2 and up 52% y/y. Additionally, while legacy volumes continued to decline at an elevated rate, it was on top of continued aggressive pricing. In sum, Q3 segment revenues net of excise taxes increased by 2.66% y/y while operating company income grew by 7.06%. Not all volumes are equal. Oral Tobacco OCI margin for Q3 was 69.25%, up a whopping 2.85pp y/y and measuring a staggering 9.60pp above Smokeables for the quarter. Oral products have much more favorable contribution profiles—especially due to the impact of MSA on cigarettes. Likewise, in addition to further price take, as on! continues to cannibalize legacy volumes, margins can expand further, as modern oral pouches currently carry even more favorable state-level excise tax dynamics.
It’s key to note that, as of late, oral tobacco has been a volume growth industry in the United States. Altria’s associated volumes have actually been far more resilient than continued market share losses suggest.
Value in context
Think of the alarm Altria has faced over the last decade. Continued regulation, restrictions, flavor bans, cost inflation, fluctuating market shares, varying degrees of price take, changes in volumes, divestments, poor investments, and new product competition. What has been the result? Altria’s FY 2012 Smokeable shipment volumes measured 136.11 billion with a reported OCI of $6.239 billion. As of Q3 2023, TTM Smokeable shipment volumes measure 79.63 billion—a 41.5% decrease from 2012. Yet TTM Smokeable reported OCI is now $10.668 billion—a 71% increase. In an equally impressive fashion, Oral Tobacco volumes grew by 3% over the period, from 763.3 million in 2012 to 786.9 million in the current trailing twelve months. While volumes have grown slowly, Oral Tobacco segment reported OCI has grown from $931 million to $1.684 billion—a staggering 80.8% increase. This increase in profitability and profits has not always been smooth, and it can be argued that things will get even bumpier as the company faces more competing products, flavor bans, and other looming threats. However, it is also easily argued that such concern is more than baked in.
I am withholding speculation on SWIC and the joint venture with JT. The same is true for NJOY, which management provides disproportionate stage time. The crux of the matter is that Altria sits at 7.5x EV/EBIT of Smokeables and Oral Tobacco operations. The company is only modestly levered, holding an interest coverage ratio over 12 and a net debt/EBITDA ratio of x1.94. Profit drivers remain intact, and minimal required reinvestment supports significant cash conversion, of which most will be returned to shareholders via dividends and share repurchases. Approximately 25% remains of this year’s $1 billion repurchase authorization to push per-share earnings marginally higher, likely followed by a new program—ideally larger in size. The company’s BUD stake, which currently carries a market value of $10.4 billion, 15% of Altria’s market cap, lingers as an excellent potential source of funds to fuel increased repurchases. A recalibration of capital structure should be of more interest than one on volume decomposition estimates.
P.S. - In the latest episode of the Preferred Shares Podcast, we discussed existential threats and the management of businesses in secular decline. You might find parallels in the conversation useful.
Did you find this piece valuable? Hit “♡ like” and give this piece a share!
Questions or thoughts to add? Comment on the site or message me on Twitter.
Ownership Disclaimer
I own positions in Altria and other tobacco companies such as Philip Morris International, British American Tobacco, Scandinavian Tobacco Group, and Imperial Brands.
Disclaimer
This publication’s content is for entertainment and educational purposes only. I am not a licensed investment professional. Nothing produced under the Invariant brand should be thought of as investment advice. Do your own research. All content is subject to interpretation.
Tags: MO 0.00%↑ PM 0.00%↑ BTI 0.00%↑ BUD 0.00%↑







There’s certainly some give and take. Marlboro Black Gold in combo with granular store-level pricing and individualized promotion via retail apps helps retain base in-brand. Monitoring price gap, share, prem share, etc helps highlight evolution. In all, affordability in U.S. still much better than most of world
Not a company specific comment, is it possible that Fed rate cuts will increase the attractiveness of high dividend paying stocks? Earning 5% in a money market does take the edge of stock investing in times of uncertainty and rising/high rates.